# CS6332:F25-Unit4 - IA32 Binary Translator (100 + 140 points)
**NOTE:** You will connect to and use `ctf-vm2.utdallas.edu` for this assignment.
In this homework you will implement a basic form of [binary translator] for Intel architecture that would instrument [single][isPrime.c] [argument][fib.c] [functions][bof0.c]. The main focus is in three folds. We want to learn *(1)* basic principles of software-based virtualization and instrumentation techniques, *(2)* CISC instruction decoding and disassembly techniques Intel architecture (i386/AMD64), and *(3)* profiling and monitoring the guest code behavior by instrumenting [inline reference monitors] on-the-fly.
The unit provides [skeleton codes] to implement a minimal binary translator for Intel architecture. In summary, your implementation will *(1)* decode Intel instruction streams, *(2)* patch the branch (or control) instruction to switch into *callout context*, *(3)* analyze program execution at runtime, and (4) apply an program analysis and/or security monitors.
Although the assignment is tested and verified for a specific version of GCC compilers in ctf-vm2 (version 5.4 and 7.3), the other environmental factors may affect compilers to generate different machine instruction sequences, resulting in runtime failures. Please feel free to consult the instructor or TA regarding such issues.
## Preliminaries
Begin the assignment by copying the provided skeleton code to your home directory on ctf-vm2, building it, and running the supplied tests. You will extend that skeleton incrementally as you complete each part of the lab.
The lab supplies several small C programs that you will instrument. Two of them are side-effect-free recursive routines — a Fibonacci implementation ([fib.c]) and a primality check ([isPrime.c]) — which exercise instruction decoding and basic instrumentation. Two additional programs are intentionally vulnerable: [bof0.c] (a buffer-overflow example) and [rop0.c] (a return-oriented programming example). The vulnerable programs also call statically buit libc functions and are provided so you can test runtime monitors and defenses against control-hijacking attacks.
All test functions are compiled so they can be invoked through a common entry point. In the source tree each guest function is aliased to user_prog; for example:
```c=12
uint64_t user_prog(void *) __attribute__((alias("fib")));
```
In the driver ([lab4.c]) the guest entry point is declared as `int64_t user_prog(void *);`. Each guest routine accepts a single integer argument and returns an integer result.
The provided [Makefile] builds four test binaries that combine the guest functions with the driver: *lab4_fib*, *lab4_prime*, *lab4_bof0*, and *lab4_rop0*. To run the tests on `ctf-vm2`, copy and extract */home/labs/unit4.zip*, change into the lab directory, then build and run each target.
```bash
# Fibonacci function.
$ make fib
$ ./lab4_fib
# Prime function.
$ make prime
$ ./lab4_prime
# bof function.
$ make bof0
$ ./lab4_bof0
# rop function.
$ make rop0
$ ./lab4_rop0
```
Note that the skeleton and tests were tuned for the toolchain on `ctf-vm2`. Different compiler versions or build environments can produce different machine instruction sequences and ABI behavior; those differences may cause runtime failures in your translator. If you encounter environment-dependent problems, collect the failing binary’s disassembly and consult the instructor or TA.
### Submission guideline.
This assignment will have two deadlines. `lab4-1` and `lab4-2` be first due at 11:59 PM, Nov 7 and `lab4-3` and the rest `lab4-4` and `lab4-5` will be due at 11:59 PM, Nov 19. To submit the assignment, you will extend the provided skeleton codes to implement a solution for each part. Please do not forget to write a *README.md* document to explain your code and
solution.
* Unit4-Part1
```
<netid>-lab04/
├── lab4-1/
├── lab4-2/
├── lab4-3/
└── README.md
```
* Unit4-Part2
```
<netid>-lab04/
├── lab4-4/
├── lab4-5/
├── lab4-6/
└── README.md
```
<!--
### Academic honesty
The submission and code should be your own. Although strongly encouraging discussions among students and with the instructor or TA, the class will not tolerate students' failure to comply with [the Student code of conduct] or any unethical behaviors. The submitted code should be of your own. We will run code similarity measurement tools against all student submissions.
-->
----
## lab4-1: Patching binary to return (30 pt)
The first step will get you warmed up and comfortable with code patching. Look at the bottom of [main()]. Just before main calls [user_prog()], it calls [StartProfiling()] which is your hook. It allows you to inspect and/or modify the target function, [user_prog()] in this case before it starts executing. Your objective is to use [StartProfiling()] to binary patch [user_prog()] to return immediately. It gives you and opportunity to inspect and/or modify the target function, [user_prog()] in this case, before it starts executing. Your objective in Part1 is to use [StartProfiling()] to binary patch [user_prog()] to *[immediately return][ret]*.
## lab4-2: Callout and return (30 pt)
In this step you should accomplish the same thing as lab4-1, but this time using [a callout][glue-IA32] that emulates function return. The trickiness is that they need to save all the registers (`EAX`, `EBX` ...) and condition registers (`EFLAGS` for Intel) because the code was not expecting a callout. The normal `gcc` calling conventions are not sufficient. Find the glue code in [ia32_callout.S][glue-IA32].
You should *patch* the first instruction on [user_prog()] with a callout. The callout should emulate the behavior of the function return behavior by returning not to the calling site of the callout (which is the normal behavior) but directly to the return `PC` on the stack. Please make sure store the original instructions before you overwrite.
:::info
**[Hint]** You will patch *user_prog()* to call [glue code][glue-IA32]. What is the format for `call` instruction?
:::
Try to add and run an arbitrary code from the callout context by replacing *NOT_IMPLEMENTED()* inside *[handleRetCallout()]* with something else. Finally, you need to ensure to call to visit *[StopProfiling()]* where you restore the original instruction of `user_prog()`.
## lab4-3: IA32 Instruction Decode (40 pt)
The goal of this step is to use *[StartProfiling()]* to decode a block of instructions. You need only to decode enough of each instruction to determine its length. By doing this you should be able to decode a block of instructions of arbitrary length. *[StartProfiling()]* should print the address, opcode, and length of instructions for *[user_prog()]* until it encounters `ret` (0xc3) instruction.
Due to the complexity of Intel ISA being CISC, the core challenge for the part is to get the right length for each instruction. On the other hand, it is simpler than ARM architecture as it has limited set of instructions which make control (branch) operations. To help you on this, we provide IA32 opcode map in *[ia32DecodeTable]*. Use it as you see fit. Or if you find any instruction not covered by the map, please feel free to update the table.
The following is the sample output.
```
input number: 10
addr 0x8049310, opcode: 55, len: 1, isCFlow: false
addr 0x8049311, opcode: 89, len: 2, isCFlow: false
addr 0x8049313, opcode: 57, len: 1, isCFlow: false
addr 0x8049314, opcode: 56, len: 1, isCFlow: false
addr 0x8049315, opcode: 53, len: 1, isCFlow: false
addr 0x8049316, opcode: 51, len: 1, isCFlow: false
addr 0x8049317, opcode: 8d, len: 3, isCFlow: false
addr 0x804931a, opcode: 89, len: 2, isCFlow: false
addr 0x804931c, opcode: 83, len: 3, isCFlow: false
addr 0x804931f, opcode: 77, len: 2, isCFlow: true
addr 0x8049321, opcode: 8b, len: 2, isCFlow: false
addr 0x8049323, opcode: ba, len: 5, isCFlow: false
addr 0x8049328, opcode: eb, len: 2, isCFlow: true
addr 0x804932a, opcode: 8b, len: 2, isCFlow: false
addr 0x804932c, opcode: 83, len: 3, isCFlow: false
addr 0x804932f, opcode: 50, len: 1, isCFlow: false
addr 0x8049330, opcode: e8, len: 5, isCFlow: true
addr 0x8049335, opcode: 83, len: 3, isCFlow: false
addr 0x8049338, opcode: 89, len: 2, isCFlow: false
addr 0x804933a, opcode: 89, len: 2, isCFlow: false
addr 0x804933c, opcode: 8b, len: 2, isCFlow: false
addr 0x804933e, opcode: 83, len: 3, isCFlow: false
addr 0x8049341, opcode: 50, len: 1, isCFlow: false
addr 0x8049342, opcode: e8, len: 5, isCFlow: true
addr 0x8049347, opcode: 83, len: 3, isCFlow: false
addr 0x804934a, opcode: 1, len: 2, isCFlow: false
addr 0x804934c, opcode: 11, len: 2, isCFlow: false
addr 0x804934e, opcode: 8d, len: 3, isCFlow: false
addr 0x8049351, opcode: 59, len: 1, isCFlow: false
addr 0x8049352, opcode: 5b, len: 1, isCFlow: false
addr 0x8049353, opcode: 5e, len: 1, isCFlow: false
addr 0x8049354, opcode: 5f, len: 1, isCFlow: false
addr 0x8049355, opcode: 5d, len: 1, isCFlow: false
addr 0x8049356, opcode: c3, len: 1, isCFlow: true
```
----
## lab4-4: Control flow following and instruction counting (60 pt)
In this part, you should now have the tools to identify the control (or branch) instructions and follow the control flow of IA32 architecture. With this, you will extend [lab4.c] to implement the same binary patching / unpatching operations you did for the previous lab.
Again, decode the instructions to be executed until you hit a control flow instruction. Binary patch the instruction to call out to handler routines instead of doing the control flow. You can then return to the guest code knowing that you will be called before execution passes that point (*i.e.,* patched control flow instruction). When your handler is called, *(1)* unpatch the patched instruction, *(2)* emulate the control behavior, and *(3)* binary patch the control instruction at the end of the following basic block (*i.e.,* next control target --- *jcc, jmp, call, ret*.)
For each basic block you encounter, record the number of instructions in that block and how many times it is visited. You should stop this process when you hit the [StopProfiling()] function. Specifically, create a data structure to capture the start address of each basic block executed, the instruction count, and the number of basic block execution. Run target program ([user_prog()]) with different inputs and check the number of instructions (and basic blocks) executions.
At the end of the execution, you will output the list of (executed) basic blocks and their instruction count and number of executions.
## lab4-5: ShadowStack (40 pt)
Using the dynamic binary instrumentation you implemented, in this task you will again implement [Shadow Stack]. Specifically, you should defend against control-hijacking attacks targeting the *lab4_bof0* and *lab4_rop0* binaries. Please ensure that your defense is robust and generalizable. To evaluate the completeness of your solution, we will also use additional test functions.
Unlike [fib.c] and [isPrime.c], the programs [bof0.c] and [rop0.c] include external calls to libc functions such as *read()*, *printf()*. To simplify the task, you may skip instrumentation for any call instructions whose targets are outside of the assignment source files.
### (Bonus) Special Considerations for External Function Calls
Because the binarie*printf()*, *exit()*, and *read()*—are included directly in the guest binary. As a result, these functions will appear inside the guest’s control flow just like any other routine.
A general guideline for handling these functions is as follows:
1. Default behavior:
Your binary translator may simply skip instrumentation for these external functions. This can be done by maintaining a blacklist or whitelist of functions that should (or should not) be instrumented.
2. Extended behavior (bonus task):
If you choose to support instrumentation of external functions, this will be treated as a bonus task. Doing so requires additional work to:
- Extend your instruction coverage,
- Emulate special function behaviors, and
- Carefully maintain isolation between guest and host contexts.
As an example, consider the *exit()* function. When the guest code invokes a sensitive or special function such as *exit()*, the translator should emulate process-termination behavior. A straightforward approach is to unwind the entire guest call stack and jump directly to [StopProfiling()]. In effect, the translator is implementing a form of exception-handling routine.
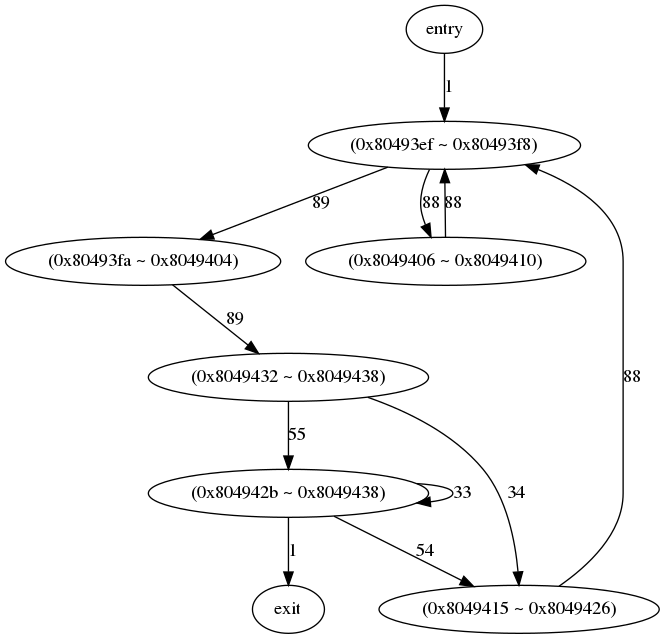
## lab4-6: Control Flow Graph (CFG) generation (40 pt)
In this part, you will extend lab4-4 to trace the control flow transition among basic blocks. To achieve, you need to modify the internal data structure to trace to control flow among different basic blocks. The exemplary entry would look like the following.
```
"(0x8049426 ~ 0x8049437)" -> "(0x8049402 ~ 0x804940b)" [label=88]
```
Here, control flow transition happened from basic block (0x8049426 ~ 0x8049437) to (0x8049402 ~ 0x804940b) for 88 times during the execution. Your output should be formatted in [DOT language] format so that it can be visualized using [graph-easy] or [dot] command.
## Resources
You may find this reference helpful for PC assembly language programming. You will need the [Intel IA32 manuals] for exact instruction formats and decoding rules. You can find them here:
* [Volume 1]
* [Volume 2]
[binary translator]:https://dl.acm.org/doi/10.1145/3321705.3329819
[skeleton codes]:https://files.syssec.org/unit4.zip
[side effects]:https://en.wikipedia.org/wiki/Side_effect_(computer_science)
[Fibonacci]:https://en.wikipedia.org/wiki/Fibonacci_number
[code]:https://theory.stanford.edu/~aiken/moss/
[similarity]:https://en.wikipedia.org/wiki/Content_similarity_detection
[measurement]:https://github.com/genchang1234/How-to-cheat-in-computer-science-101
[tools]:https://ieeexplore.ieee.org/document/5286623
[optimized]:https://www.sciencedirect.com/topics/computer-science/conditional-execution
[inline reference monitors]:https://files.syssec.org/0907-mm.pdf
[Intel IA32 manuals]:https://www.intel.com/content/www/us/en/developer/articles/technical/intel-sdm.html
[Volume 1]:https://www.intel.com/content/dam/www/public/us/en/documents/manuals/64-ia-32-architectures-software-developer-vol-1-manual.pdf
[Volume 2]:https://www.intel.com/content/dam/www/public/us/en/documents/manuals/64-ia-32-architectures-software-developer-instruction-set-reference-manual-325383.pdf
[Makefile]:https://gitlab.syssec.org/kjee/unit4-binary-translator/-/blob/main/Makefile
[lab4.c]:https://gitlab.syssec.org/kjee/unit4-binary-translator/-/blob/main/lab4.c
[bof0.c]:https://gitlab.syssec.org/kjee/unit4-binary-translator/-/blob/main/bof0.c
[rop0.c]:https://gitlab.syssec.org/kjee/unit4-binary-translator/-/blob/main/rop0.c
[isPrime.c]:https://gitlab.syssec.org/kjee/unit4-binary-translator/-/blob/main/isPrime.c
[main()]:https://gitlab.syssec.org/kjee/unit4-binary-translator/-/blob/main/lab4.c#L79
[fib.c]:https://gitlab.syssec.org/kjee/unit4-binary-translator/-/blob/main/fib.c
[user_prog()]:https://gitlab.syssec.org/kjee/unit4-binary-translator/-/blob/main/lab4.c#L21
[StartProfiling()]:https://gitlab.syssec.org/kjee/unit4-binary-translator/-/blob/main/lab4.c#L68
[StopProfiling()]:https://gitlab.syssec.org/kjee/unit4-binary-translator/-/blob/main/lab4.c#L70
[ia32DecodeTable]:https://gitlab.syssec.org/kjee/unit4-binary-translator/-/blob/main/ia32_disas.c
[memoization]:https://en.wikipedia.org/wiki/Memoization
[handleRetCallout()]:https://gitlab.syssec.org/kjee/unit4-binary-translator/-/blob/main/ia32_callout.S#L30
[glue-IA32]:https://gitlab.syssec.org/kjee/unit4-binary-translator/-/blob/main/ia32_callout.S
[graphviz]:https://graphviz.org/
[DOT Language]:https://graphviz.org/doc/info/lang.html
[graph-easy]:https://github.com/ironcamel/Graph-Easy
[dot]:https://graphviz.org/doc/info/command.html
[ret]:https://www.felixcloutier.com/x86/ret
[Shadow stack]:https://en.wikipedia.org/wiki/Shadow_stack